59
2013
Annual Report
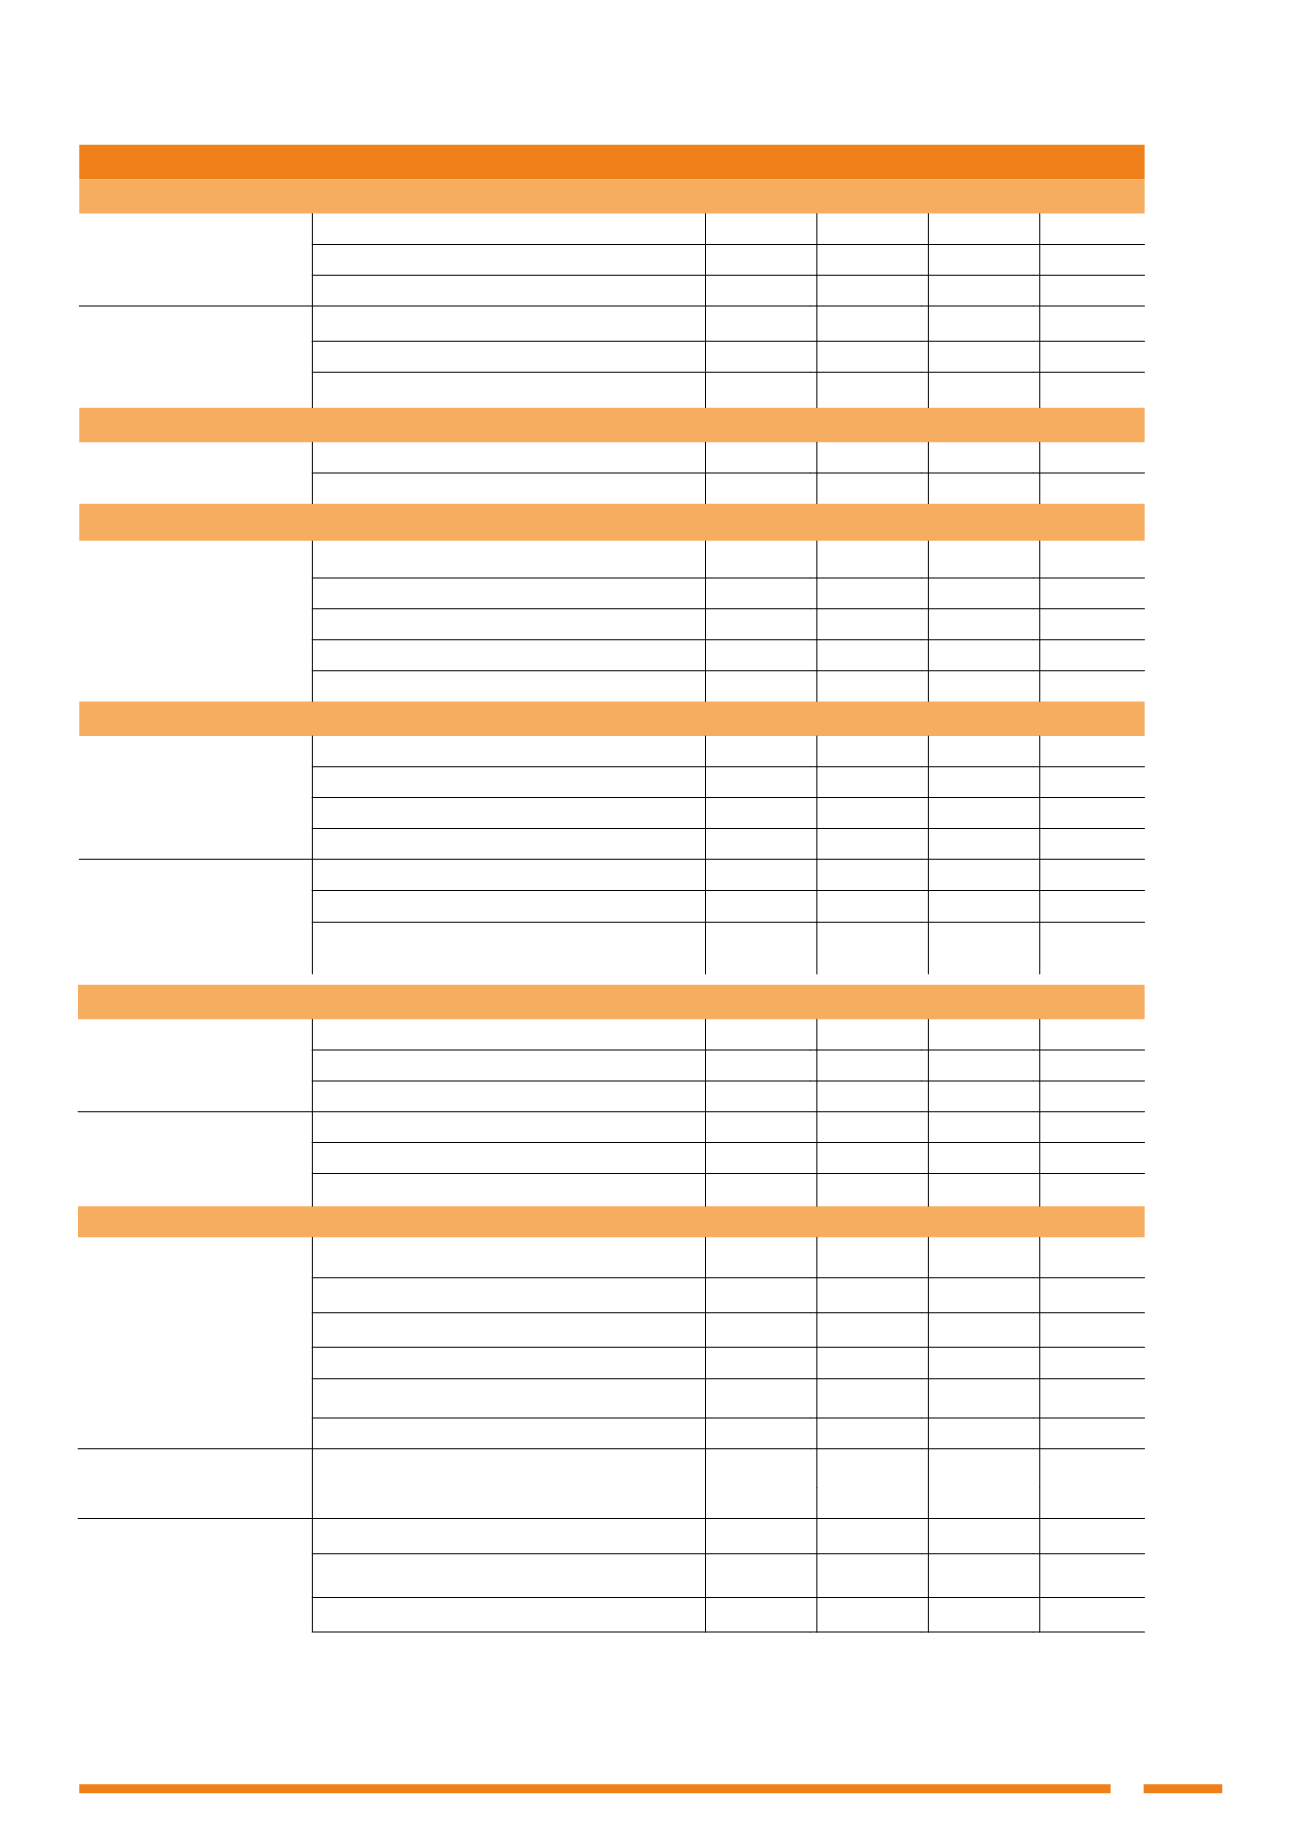
ASPECT
2011
2012
2013
Unit
ENERGY CONSUMPTION
Total
30.669,53
27.495,45
28.295,87
Mwh
Electricity consumption
Corporate consumption
1.924,49
1.966,40
1.923,31
Mwh
Production consumption
28.745,05
25.529,05
26.372,56
Mwh
Diesel
Generators
0,96
3,35
3,95
Tons
Company cars
56,42
57,06
56,32
Tons
Employees’ cars
61,35
43,29
31,80
Tons
RESOURCES CONSUMPTION
Water
809 building
3.202
3.183
2.553
m3
226 building
2.082
1.585
1.426
m3
PAPER CONSUMPTION
Paper
Bills printed
67,36
64,81
35,36
Tons
Magazines published
84,43
26,92
12,39
Tons
Advertising mailshots
131,42
133,59
93,63
Tons
Materials (envelopes. forms)
0,78
0,49
0,41
Tons
Printing equipment (office)
7,88
7,05
6,60
Tons
MATERIALS CONSUMPTION
Cables
Fibre Optic cables
52,85
17,15
11,74
Tons
Pairs cable
100,67
59,62
18,88
Tons
Coaxial cable
84,64
80,78
26,52
Tons
Siamese cable
14,75
15,65
7,5
Tons
Equipment
Broadband equipment
60,31
42,60
29,54
Tons
TV equipment
152,00
95,23
35,68
Tons
Telephone equipment
16,14
10,29
9,85
Tons
WASTE
Non-hazardous waste
Cellulosic (paper and cardboard)
56,78
45,58
37,85
Tons
Waste stream (electric and electronic)
33,68
57,01
37,87
Tons
Alkaline batteries
0,25
0,14
0,12
Tons
Hazardous waste
Button batteries
240
310
430
grams
Acid lead battery
16,88
10,77
6,68
Tons
Fluorescent
0,54
0,48
0,61
Tons
EMISSIONS
GHG Direct
CO2
180,74
190,30
189,85
Eq. CO2 Ton
(scope1)
CH
4
0,24
0,25
0,25
Eq. CO2 Ton
N
2
O
2,83
2,88
2,84
Eq. CO2 Ton
HFC
231,02
12,31
147,89
Eq. CO2 Ton
PFC
0,00
0,00
0,00
Eq. CO2 Ton
SF
6
0,00
0,00
0,00
Eq. CO2 Ton
GHG indirect
CO2
6.839,31
6.626,40
4.926,21 Eq. CO2 Ton
(scope 2)
Other emissions into the air
SO
2
0,29
0,31
0,31
Tons
NO
X
2,24
2,35
2,35
Tons
Solid Particles
0,22
0,24
0,23
Tons


