85
2013
Annual Report
21
2013
2012
Non-current payables
119,387
108,776
Loans and borrowings
115,587
108,706
Derivatives
893
-
Other financial liabilities
2,907
70
Group companies and associates, non-current
104,416
175,795
Current payables
98,550
112,100
Loans and borrowings
84,295
91,125
Other financial liabilities (suppliers of fixed assets)
14,255
20,975
Group companies and associates, current
22,682
35,005
Loans and borrowings
22,682
35,005
Trade and other payables
53,554
50,888
Suppliers
46,734
49,025
Personnel
6,820
1,863
Total financial liabilities
398,589
482,564
Trade and other payables
7,915
6,860
Public entities, other
7,915
6,860
Total balances on balance sheet
406,504
489,424
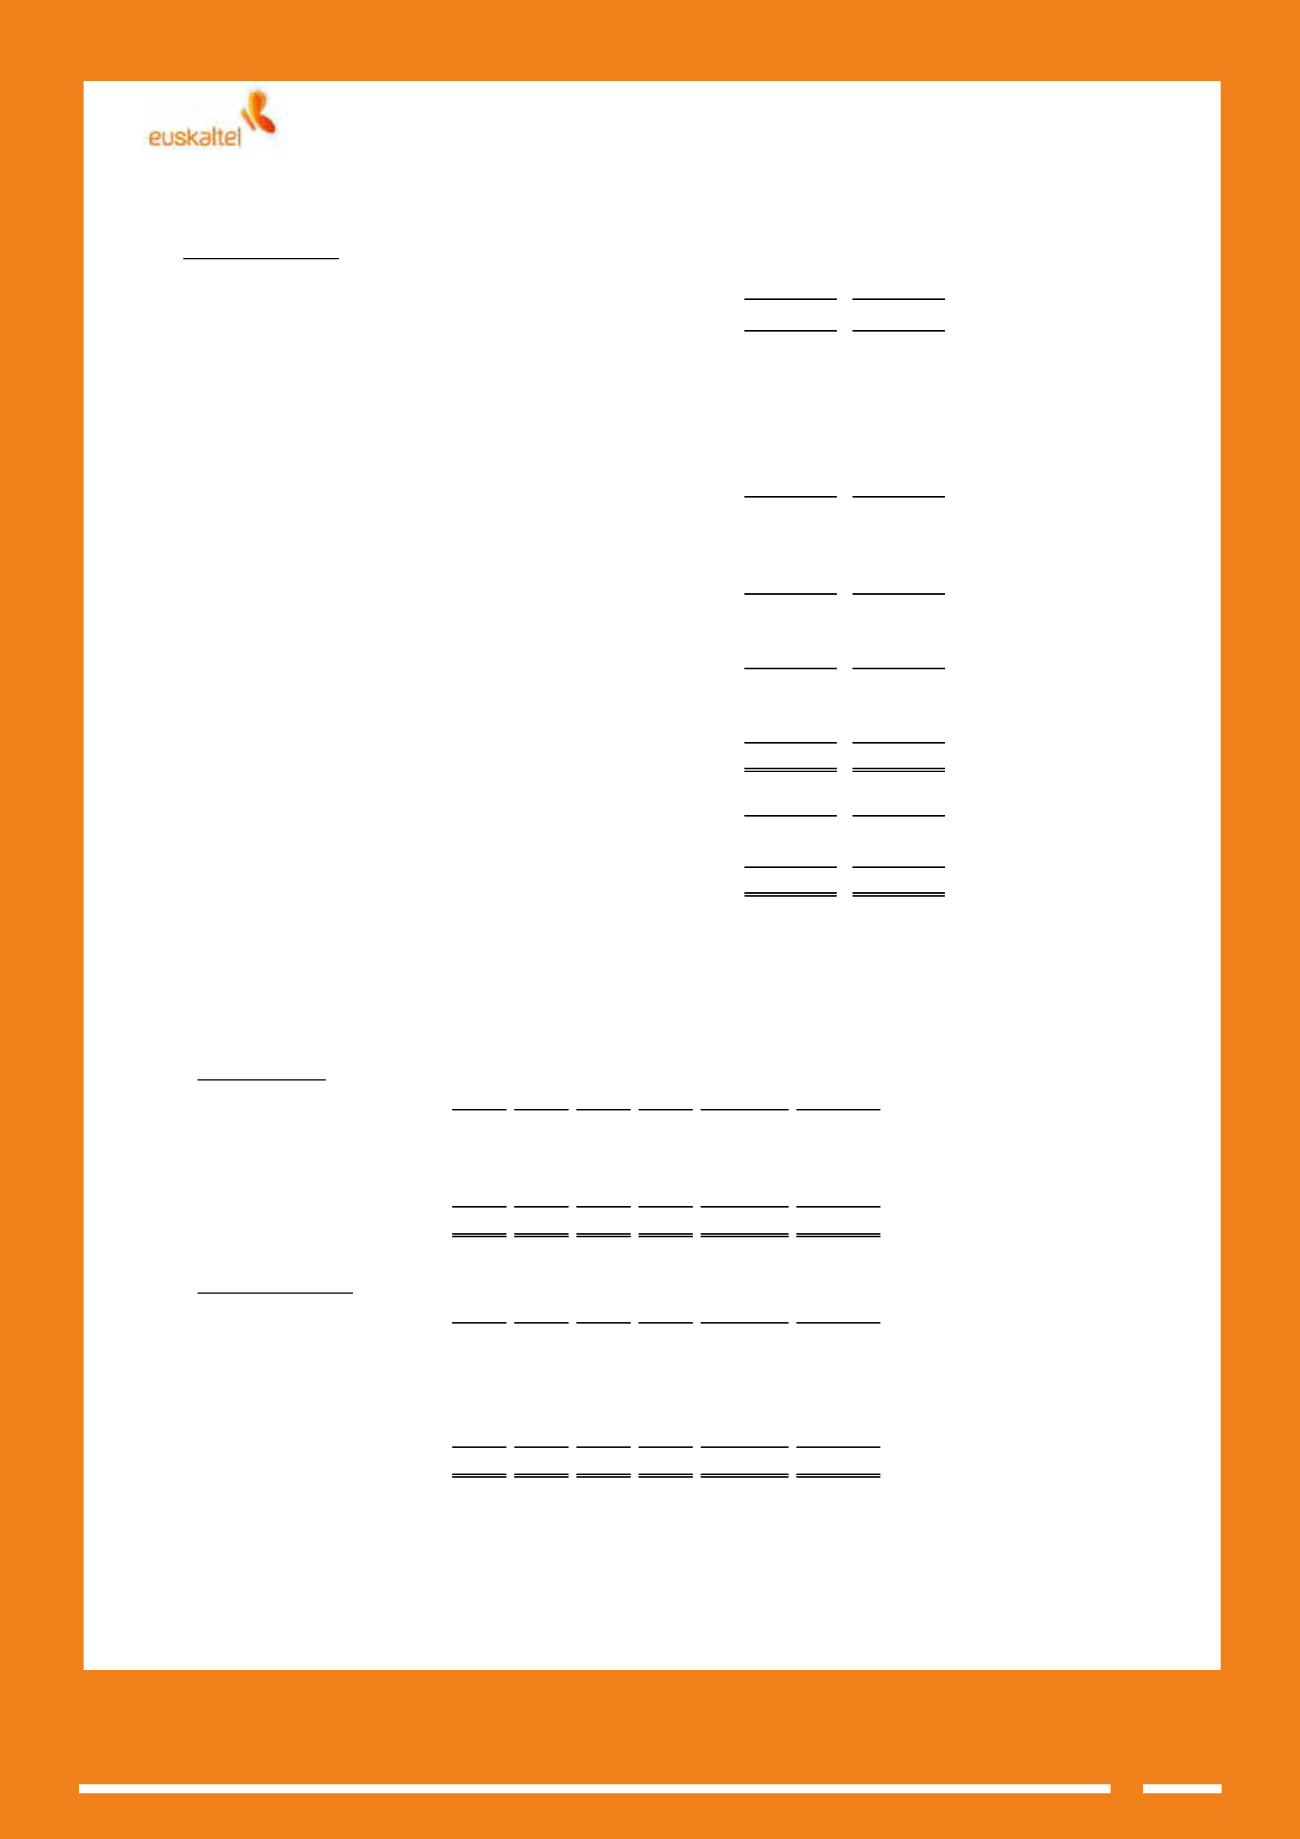
b)
Financial liabilities
7.2.
Analysis by maturity
Details of non-current financial instruments with a fixed or determinable maturity classified by year of
maturity at 31 December 2013 are as follows:
a)
Financial assets
b)
Financial liabilities
2015 2016 2017 2018 Thereafter
Total
Loans to Group companies and associates
3
3
2
-
-
8
Derivatives
-
-
92
-
-
92
Loans to third parties
-
-
-
-
1,941
1,941
Total
3
3
94
-
1,941
2,041
2015 2016 2017 2018 Thereafter
Total
Loans and borrowings
31,074 40,415 44,098
-
-
115,587
Other financial liabilities
4
9
9
9
2,876
2,907
Group companies and associates
17,745 12,037 30,045 30,045
14,544
104,416
Derivatives
-
143
427
215
108
893
Total
48,823 52,604 74,579 30,269
17,528 223,803


